- Patent Visualization Function
What is the Patent Visualization Function
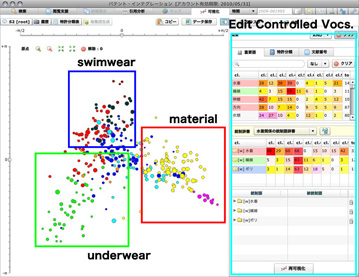
Similar patents is organized automatically in the same group. Moreover, the patents are arranged in the order of their filing date. The visualization result can be rotated in any direction. You can look at the search result from various aspects.

- The upper bound of visualization patents number is 500. For population more than 500 patents, you can select the top 500 by filing date, publication date, publication number, score, PI score.
Visualization function can be used for the following usage.
Technology Trend Research.
The Technology Trend Research is an investigation that analyzes the status of progress and the directionality of technological development on the basis of the technical intelligence or patent information and the marketing research.
500 patent applications constitute a single technology. The development of the technology can be looked at while paying attention to a relative relation of each patent application arranging by filling date.
It is tedious to look at the development of the technology even less than a hundred patent documents. When we pay attention to each patent too much, the group that too subdivides is made. It opaques the viewability of the result of the survey. By using the visualization function, we can proceed the descriptive survey while considering micro-cluster consisting of several patents.
Moreover, we can classify by the applicants or inventors, and put the sign on an important key words or patent classifications. The development of the technology can be chased from various viewpoints by using these various functions.
Patent Integration is designed for not only the investigation specialty member but also the research and development employment. The engineer can study the development of various technologies through the investigation process.
Writing of a Review Paper.
The purpose of a review paper is to succinctly review recent progress in a particular topic. Overall, the paper summarizes the current state of knowledge of the topic. It creates an understanding of the topic for the reader by discussing the findings presented in recent research papers (see: Univ of Wisconsin).
Review papers are very valuable for engineers in other departments and colleagues. Without the review paper, we must read many (low relationship) papers to study other technology areas.
By using visualization function, a search result of some hundreds of patent documents, can be grouped according to similarity. Actually, grouped result will not not perfect. But based on the automatic grouping, you can easily create a review paper with your subjective opinion.
Reference of Thinking method such as KJ method.
KJ method was developed by Kawakita Jiro in 1960s, a way to organize data. Diagram was created by the method is known as the Affinity Diagram of Seven Management and Planning Tools. KJ method includes write data to the card, the card together in groups, and illustrate and summarize the paper. By using the KJ method, teams can share the position of the each data. In addition, the work may be one of the brainstorming process.
How to facilitate KJ method.
STEP 1. Create cards of the theme.
- Write one data in one card.
- Application to patent: Write one patent abstract and figure in one card.
STEP 2. Confirm and Share the meaning of the card.
- All members of the group confirm and share the meaning of each card.
STEP 3. Create small group and Labeling.
- Bring together the contents of similar data. And create small groups.
- Read cards of each small group. And summarize to label the meaning of the small groups.
- Set the label as a card.
STEP 4. Illustrate.
- Place the groups on a large paper while considering the relations between groups.
STEP 5. Summary
- All members think about the importance of the group and the card while seeing the illustration.
STEP 6. Report
- All members make report while seeing the illustration.
The result of visualization corresponds to illustration of STEP4.
The KJ method can be done from STEP1 or STEP3 referring to the result of the visualization. We can productively proceed brainstorm by considering a visualization result.
 中文
中文 台灣
台灣 한글
한글 Deutsch
 Français
 Sueco
Sueco Finlandês
 Italiano
 Español
 Português
 हिन्दी
 Russian
 עברית
עברית Arabic
 日本語
日本語